Google Data Studio is one of the most powerful reporting tools in an SEO’s toolkit.
You can use it to create intuitive and interactive dashboards that make it easy as pie (charts) to track the metrics that matter and get buy-in from clients or the C-suite on your latest SEO initiative.
But since it’s not exactly the most intuitive tool you’ll ever use… it’s very easy to end up with a hot mess instead of hot takes.
And that’s where Lazarina Stoy comes in…
In this 13-part video course, she’ll take you from GDS zero to hero.

Already a Traffic Think Tank Member? Click here to access this content, or...
Join Traffic Think Tank ▶Here’s what you’ll learn in this course:
- In lesson one, you’ll learn everything you need to know about GDS connectors, including some common use cases for using them for reporting in the digital marketing space.
- In lesson two, you’ll discover how to connect data sources that don’t have an existing Data Studio connector via manual exports, API integrations, or building your own connector.
- In lesson three, Lazarina walks you through how to create custom dimensions in GDS – and how to get the most from them.
- In lesson four, you’ll discover the most common use cases for applying filtering in your GDS dashboards (and the benefits and drawbacks that come with them).
- In lesson five, Lazarina walks you through Google Data Studio’s biggest pitfalls and limitations – and how to overcome them.
- In lesson six, Lazarina reveals the QA process she uses to ensure the data presented in her GDS dashboards is always accurate and accessible.
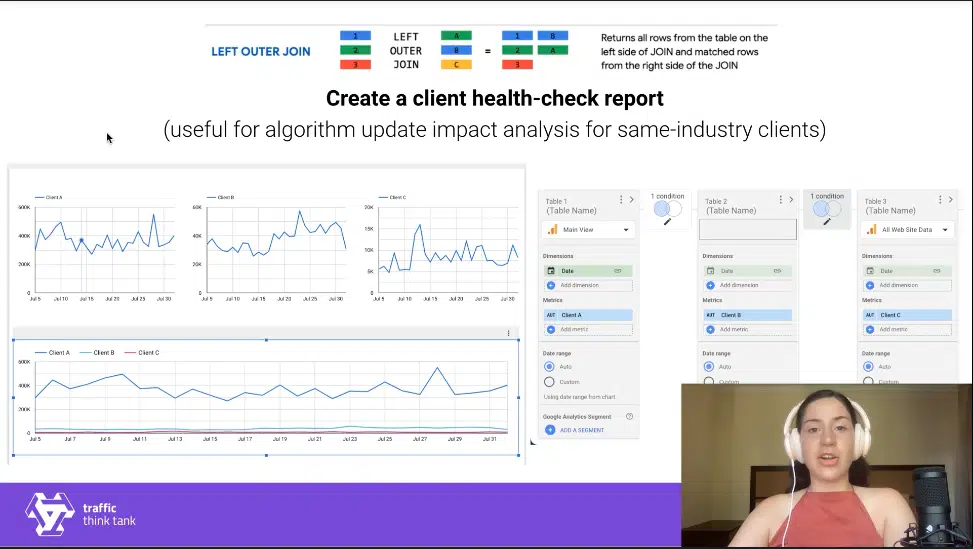
- In lesson seven, you’ll learn what data blending is in GDS, how to leverage it to get actionable insights, and its challenges and limitations.
- Look over Lazarina’s shoulder in lesson eight while she dives into some practical data blending opportunities in GDS you can start exploring today.
- In lesson nine, Lazarina shows you when and where to use advanced visualizations in your reporting through some practical examples.
- GDS annotations can help you and your stakeholders more easily understand the data you’re looking at. In lesson ten, you’ll learn three ways to add them to your GDS dashboards (alongside some real-life use cases).
- Your GDS dashboards are only useful if they’re easy to understand and intuitive to use. In lesson eleven, Lazarina walks you through how to style and deliver your GDS dashboards effectively, professionally, and confidently.
- In lesson twelve, Lazarina reveals how to use the art of storytelling to walk stakeholders through the insights revealed by your GDS dashboards (and get buy-in for your SEO initiatives).
- In the thirteenth and final lesson, you’ll learn how to incentivise stakeholders to get the most from the GDS dashboards you build in their day-to-day work.
Featured Speakers

SEO & Data Science Manager • Speaker • Data and Automations Geek


